
For most of the past decade, buying a house in this market meant waiving the inspection, paying over asking, and hoping. For a lot of people that is the only version of this market they have ever seen.
It is not the version we are in right now, and the local story is staggering. Over the past year, Minnesota added more homes for sale than any other state in the country.
Inventory is not the whole picture. Rates matter, prices matter, and what is happening on your particular street matters more than either. But inventory is the thing that decides whether you get to negotiate at all, and here it just moved further than anywhere else in the country.
I don't usually write these. This one is worth the clutter.
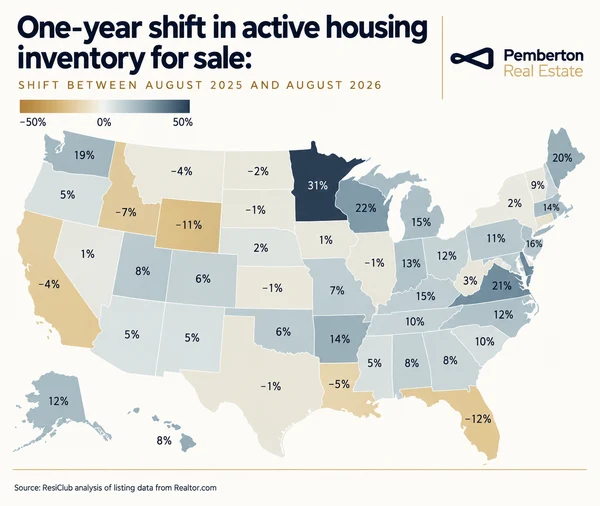
That map shows how the number of homes for sale changed in every state over the past year. Minnesota is up 31%.
Not top five. First, by a wide margin.
What That Actually Means Here
A percentage on a map is easy to wave off, so here is the same story from the local data. In July, statewide inventory hit 20,084 homes for sale, up 9.1% year over year, and the Twin Cities metro reached 11,586, up 6.7%. Months' supply in the metro moved to 3.0 months, statewide to 3.5. Those are the highest inventory levels Minnesota has seen in seven years, and Minnesota Realtors described the market as the most balanced it has been since July 2017.
Seven years. That is how far back you have to go to find a Minnesota buyer who had this much to choose from, and it is why the waived inspections and the over-asking offers started to feel less like a market condition and more like the rules.
And it is changing here specifically. Florida is down. California is down. Whatever is loosening up in Minnesota is not a national weather pattern that happened to blow through. The leverage showing up on the north side of the metro is not showing up everywhere.
Now Add the Calendar
Fall and winter have always tilted toward buyers. Fewer people shopping, more motivated sellers, and anyone still listed in November has usually decided they would rather sell than wait.
ATTOM measures this across millions of sales by comparing what buyers pay against automated valuations. Nationally, November is the cheapest month to buy, at a 7.3% premium over valuation. October is next at 7.4%, then December at 7.6%. The spread against peak season is real: buyers closing on December 4 paid a 4.8% premium, against 14.6% for buyers closing on May 27.
None of that is exotic. It is the same seasonal tilt every year. What is unusual is the combination. Seven-year-high inventory walking into the slow season is not a thing this market has offered in a long time.
I can't share details on transactions that haven't closed. But anecdotally, I am finding real leverage for the buyers I am working with right now. Conversations that would have ended with "the seller has other offers" a year ago are ending very differently.
One Caution, Because "Buyer's Market" Gets People in Trouble
Here is where I'd push back on the version of this that shows up on social media.
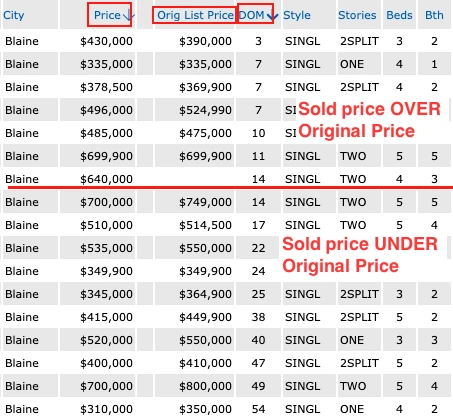
That is every sale in that band, sorted by how long it took. Above the red line, homes that went in about two weeks sold at or over their original list price. Below it, the longer a house sat, the deeper the discount ran. With very few exceptions, the pattern holds all the way down.
The statewide numbers say the same thing from the other direction. Minnesota sellers are still getting 98.3% of original list price on average, and metro sellers 99.1%. Median sale price in the metro was $408,000, up 3.3% year over year. Homes are still selling in about 40 days in the metro.
That is not a collapsing market. That is a market where a well-priced house still goes fast and close to full price, and where the leverage lives almost entirely in the listings that have been sitting.
So the skill is not "offer under asking." The skill is knowing which house you are standing in before you write. Get that wrong on a fresh listing and you lose it to someone who read the room. Get it right on a stale one and you save real money. This is the same thing I mean when I talk about treating list price as a hypothesis rather than a number, only now you are on the other side of it.
Ali, not Rocky. Patience first, then you pick your spot.
"But I'm Selling And Buying"
Some of you are already thinking it. If it's a buyer's market, doesn't that make it a bad time to list?
Fair question, and the honest answer is that you almost never get both sides of the market in your favor at the same time. Anyone who tells you otherwise is selling something.
So the question isn't "is this a good time to sell." It's what the net effect is once both trades are done.
Run it. Say you sell your $350,000 house for $10,000 less than you might have gotten a year ago. Then you buy the $600,000 house for $20,000 less than you would have paid. You are up $10,000 on the pair, and you are in the bigger house.
That is the whole argument for moving up in a softer market, and it is why the spread works in your favor the further up you go. The dollars move with the price, so a discount on the more expensive side is simply worth more than the discount you gave up on the cheaper one. I walk through the full version of this math, including the timing and financing side, in the move-up guide.
Judge the move, not the listing.
What I Would Do With This
If you have been the one saying "when the right opportunity comes along," this is roughly what that looks like from the inside. It does not announce itself. It shows up as a slightly longer list of options, a seller who takes the call, and an inspection you actually get to do.
A few practical notes. Inventory this high does not last indefinitely, and the seasonal window closes in February. If you are selling as well as buying, the work that gets a house into the fast-selling group is smaller and cheaper than most people assume, and it wants to start before you list, not after.
And if you are buying, come in knowing which category each house falls into. Days on market is public, original list price is public, and the gap between the two tells you most of what you need to know before you ever write a number down.
Happy to run your specific numbers. No pitch, just a conversation.
Sources. State-by-state inventory change from ResiClub Analytics' analysis of Realtor.com active listing data. Minnesota and Twin Cities figures from the July 2026 Minnesota Realtors and Minneapolis Area Realtors monthly market reports, as summarized by the St. Paul Area Association of Realtors. Seasonal purchase premiums from ATTOM's analysis of best days to buy and sell. Blaine sold data from NorthstarMLS, single-family homes $300,000 to $700,000 closed in the 30 days ending September 8, 2026.